The Snapshot Dashboard is available to all Genius Licenses holders and gives Admins/Supervisors the ability to view agents and team call metrics.
- To view your dashboard select the Analytics" section on the left-hand side navigation.
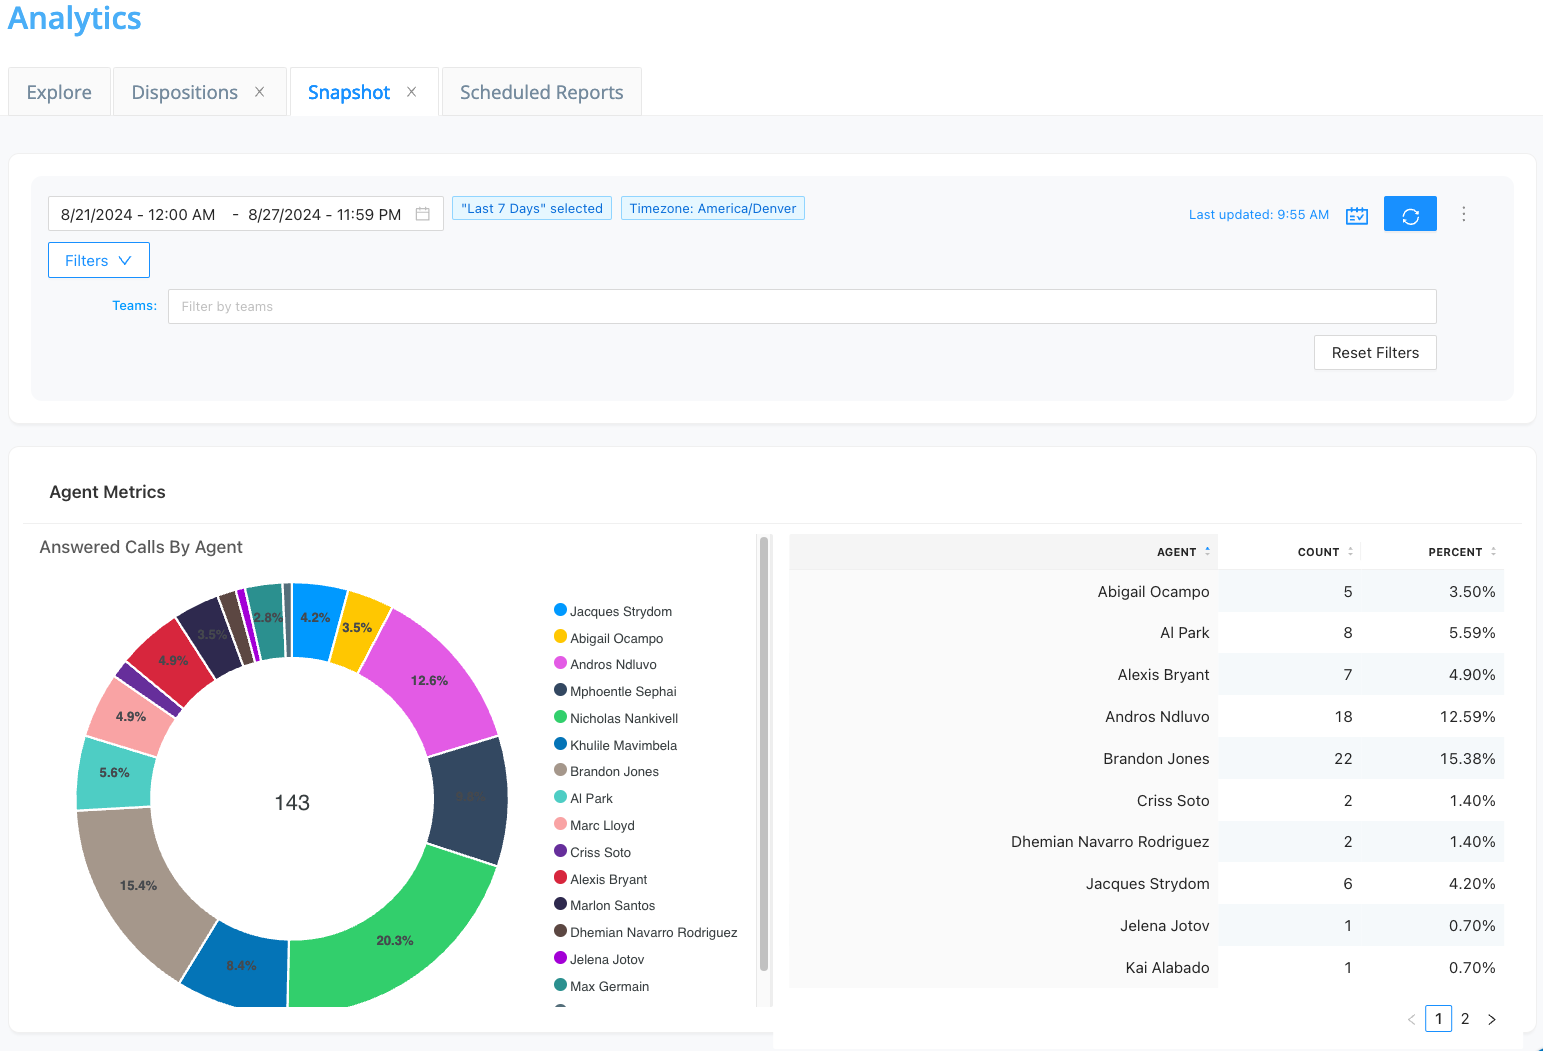
- Then select the "Snapshot" tab
- Next, filter by one or multiple teams for your dashboard visualization using the "Filter by Team" drop-down located on the top left-hand side.
-
Date and Timezone - Use the date picker located on the top right corner to select the desired date range
- By default, the dashboard will use your account Timezone
- Using the shortcuts to select the time interval
- Your dashboard will automatically update based on your filter criteria