The Teams Report / Dashboard allows admins to view the analytics on all Inbound Team Calls.
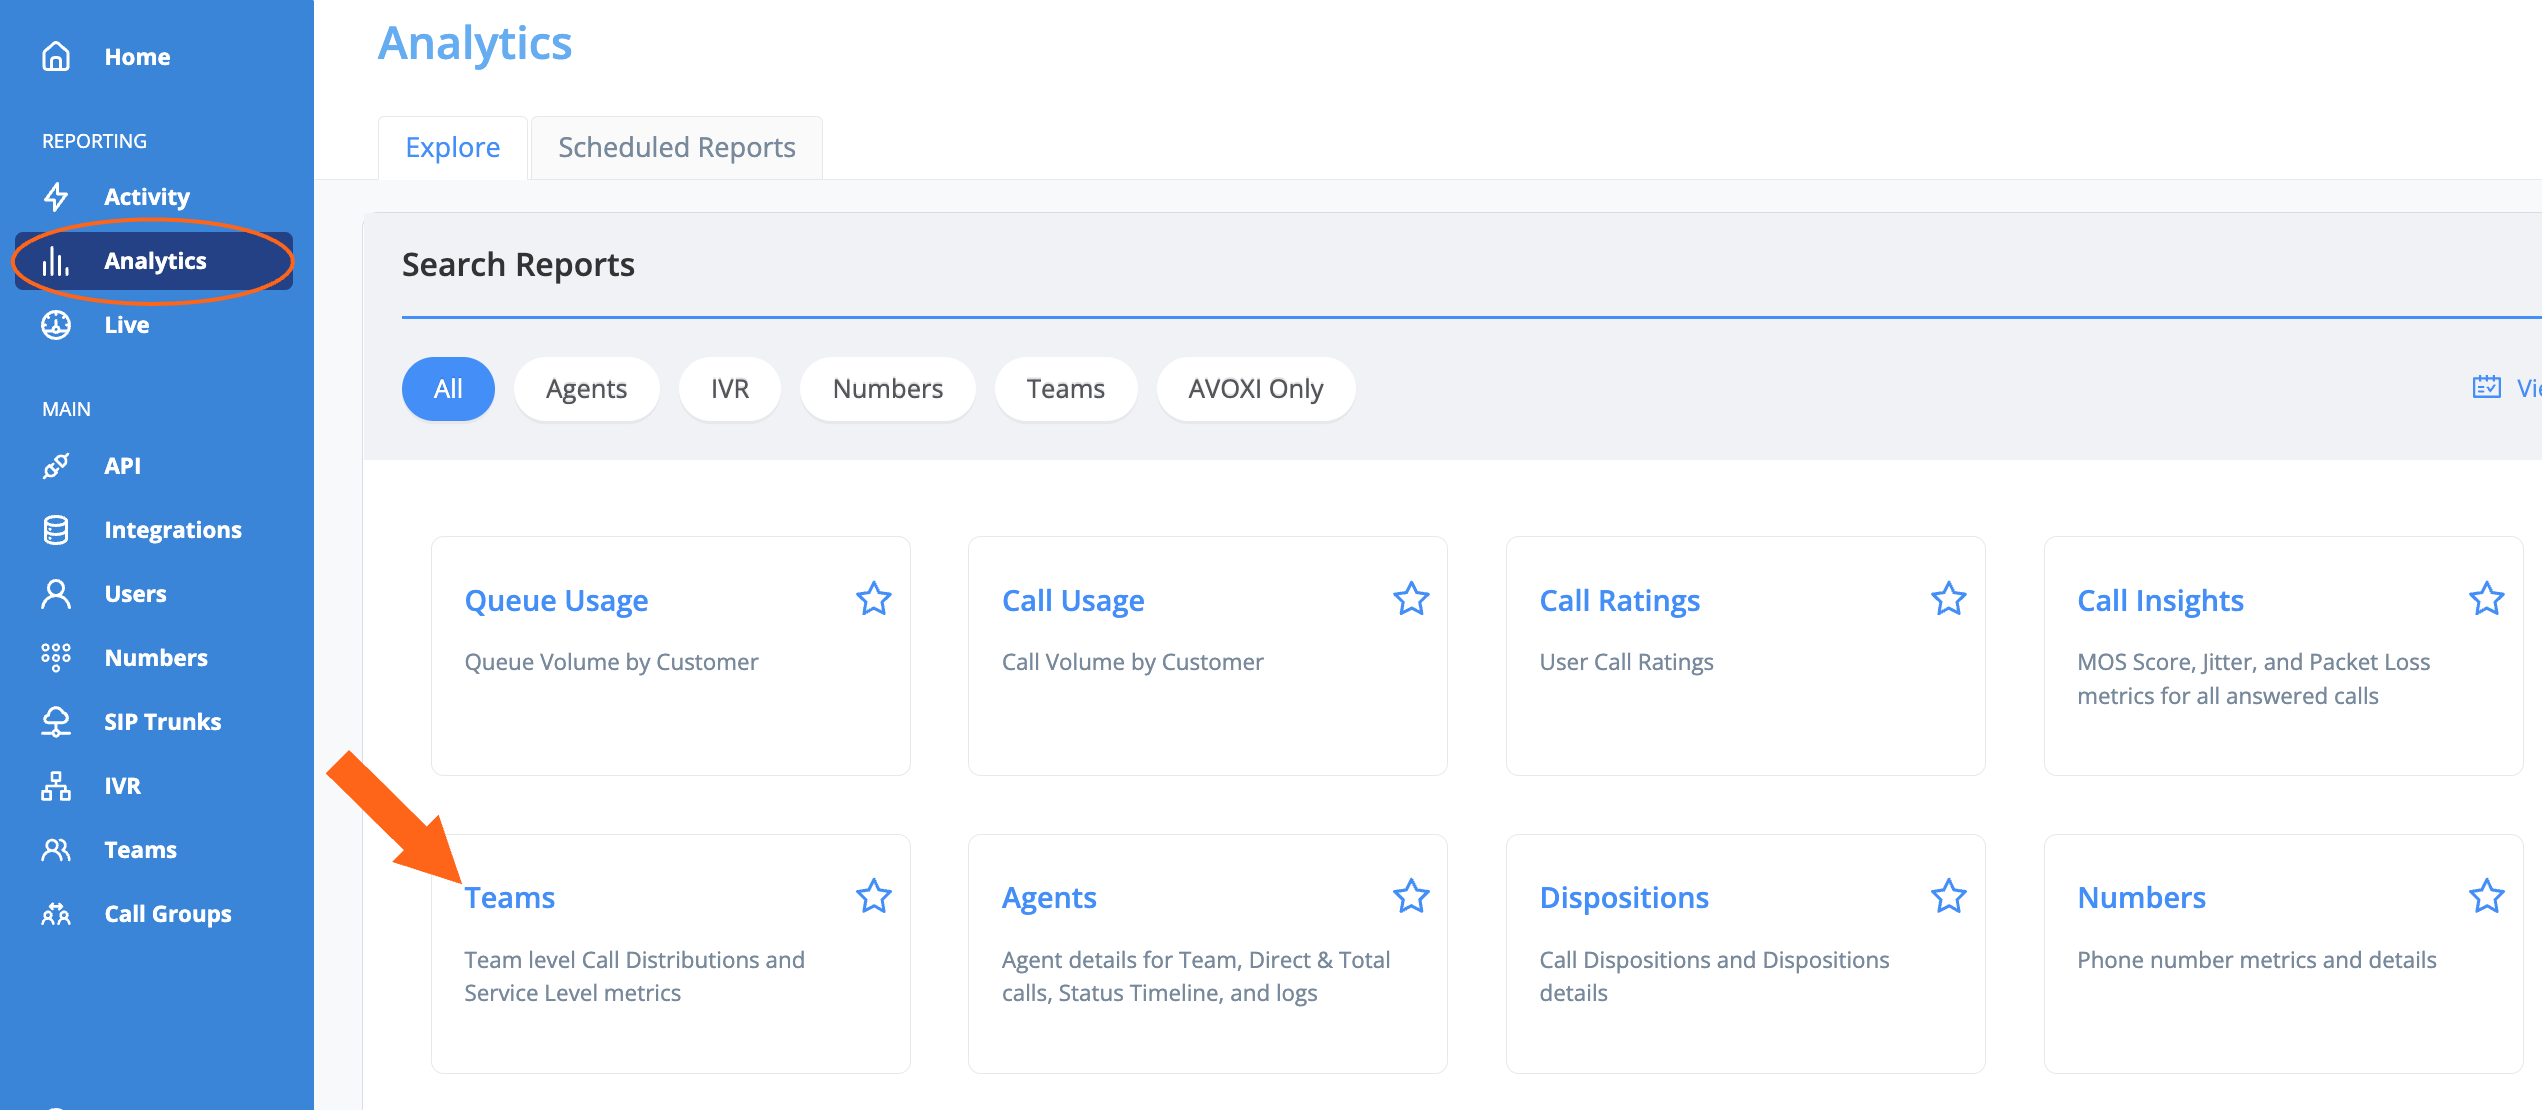
- To view your "Inbound Team Calls" analytics report select the "Analytics" section on the left-hand side navigation.
- Navigate to the "Teams" dashboard.
Data Aggregation
Within the Teams report, users are able to select either a Day of the Week, Date, or Hourly aggregation. This aggregation applies to the Answered and Unanswered/Abandoned call distribution tables at the bottom of the page, as well as the call distribution chart

Day of the Week
The Day of the Week aggregation takes the selected date range and groups all of the data for that range by the day of the week (Monday-Sunday). For example, if you choose a 30-day range, you will see all of the data for calls that occurred on a Monday on one row, all calls that took place on a Tuesday on another row, and so on.
Date
The Date aggregation takes the selected date range and displays data in the table according to the date on which the calls took place. For example, if you select a date range from January 1 to January 7 of a specific year, the table will display data for all calls that took place on January 1 on one row, all call from January 2 on another row, and so on.
Hourly
The Hourly aggregation works similarly to the day of the week. It groups data according to the time of day (00:00-23:59) when the call occurred. For example, if you choose a 30-day range, the table will display all calls that took place within a particular hour during the selected date range. All calls that took occurred between 8 AM and 9 Am will be on one row, all calls that occurred between 9 AM and 10 AM on another row, and so on.
Date and Timezone
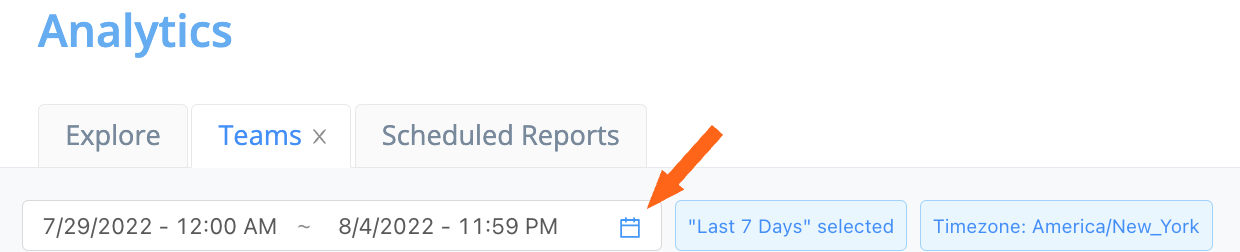
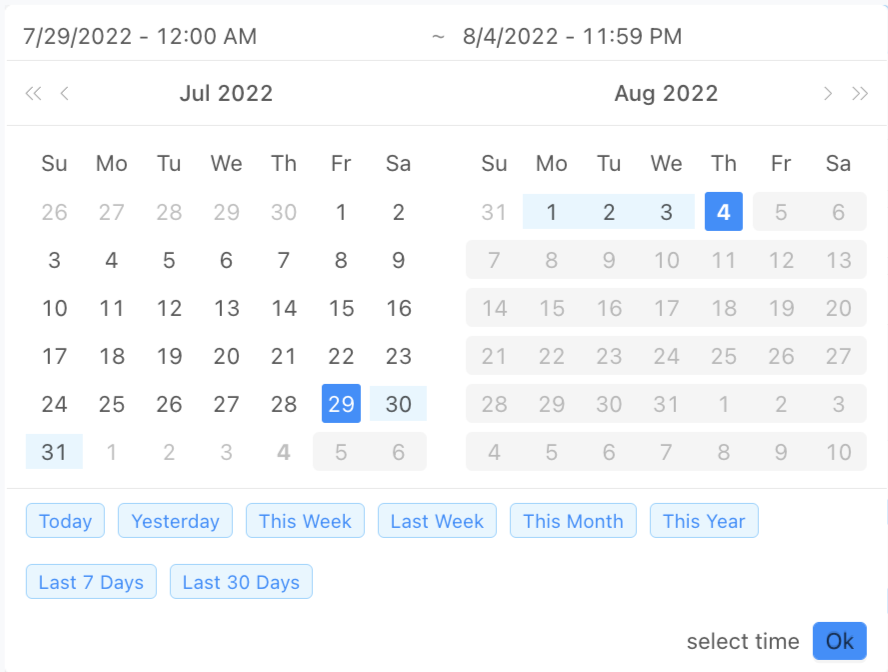
- Use the date picker in the top right corner to select the desired date range.
- By default, the dashboard will use your account Timezone
- Using the shortcuts to select the time interval
- Your dashboard will automatically update based on your filter criteria.
Inbound Team Calls Metrics Dashboard
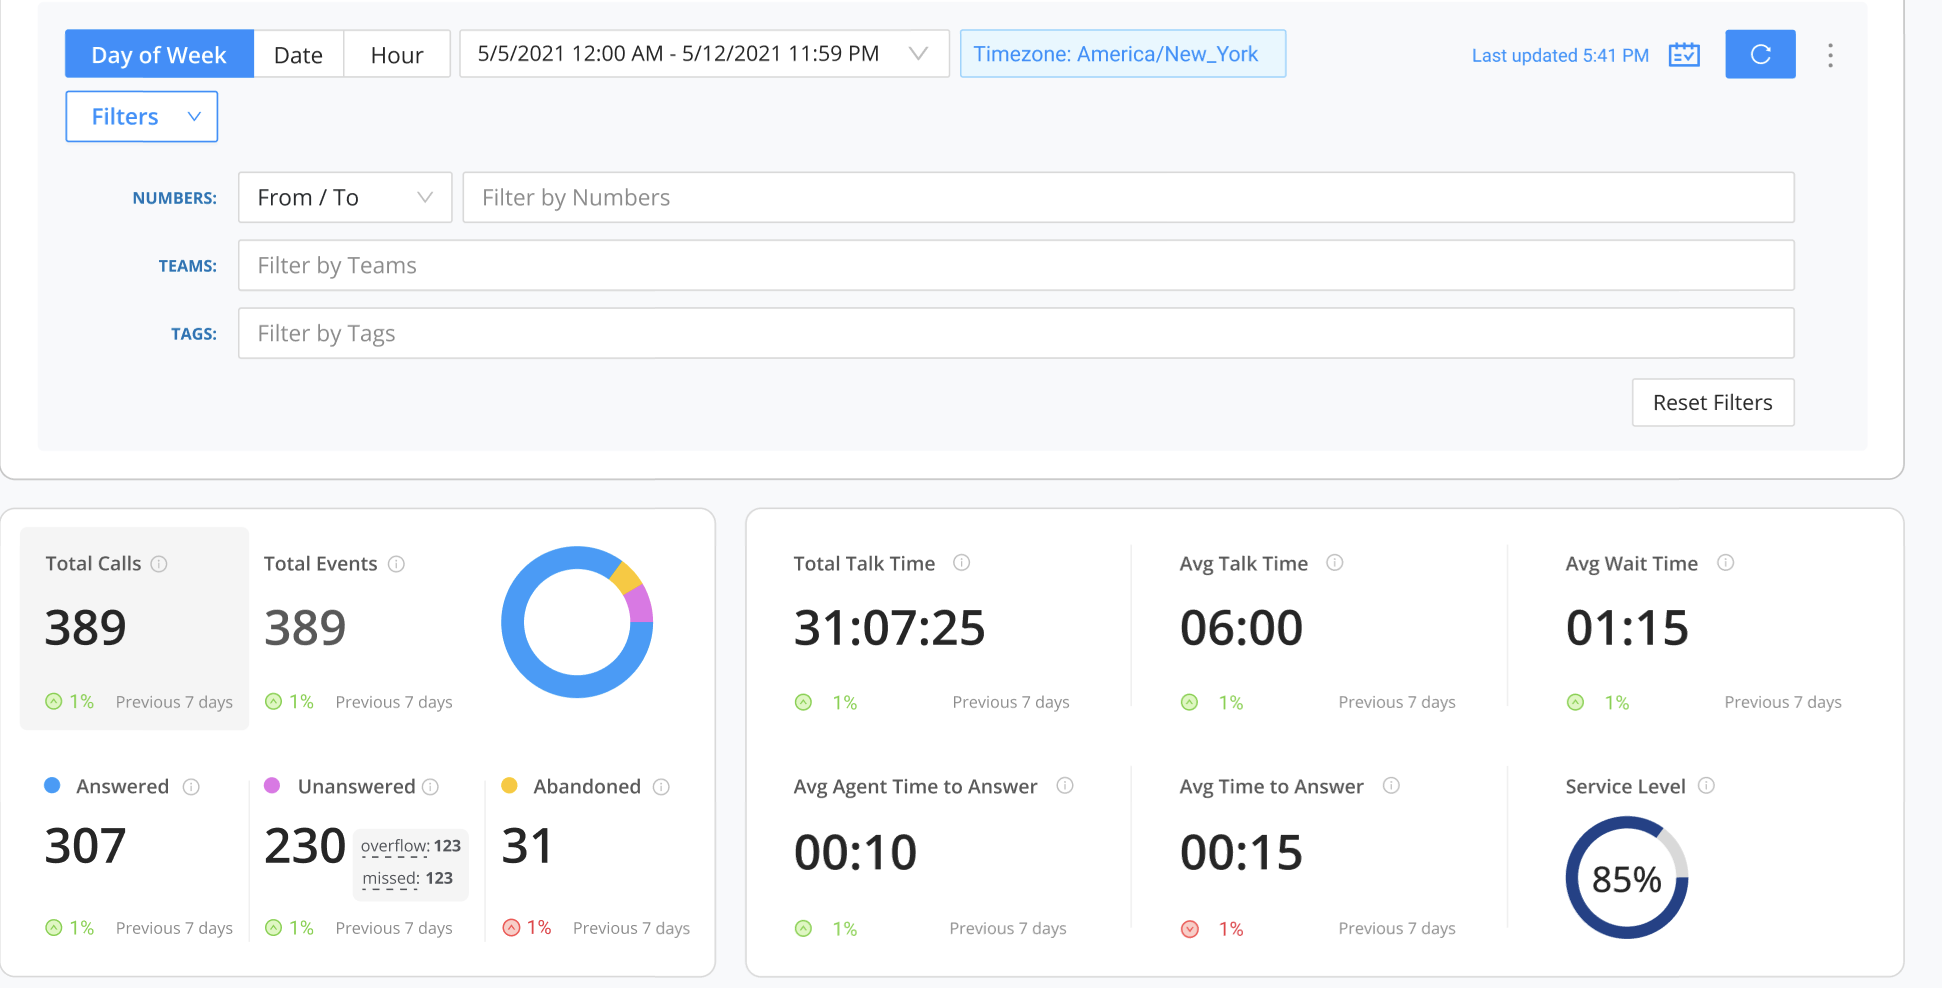
Use the "Filters" drop-down to view metrics for your desired Teams, Numbers, or Tags.
- Total Calls: The number of inbound calls your Call Center receives.
- Total Events: Number of Answered, Unanswered, and Abandoned events for inbound team calls.
- Answered Calls: Is the number of inbound calls answered by your Agents
-
Unanswered Calls: Calls alerted one or more team members but were not answered.
- Overflow: Unanswered calls are considered overflow when no agents are available at the time of the call.
- Missed: Unanswered calls are considered missed when they are presented to an agent but not answered.
- Abandoned Calls: This is the number of disconnected calls before a team member could answer the call.
- Total Talk Time: This is the total amount of time an agent spends talking to a caller.
- Avg Talk Time: The average time the agent takes to handle a call.
- Avg Wait Time: The average time calls spend in a Team's queue before they are Answered, Unanswered, or Abandoned.
- Avg Agent Time to Answer: The average time calls ring to available agents before they are Answered.
- Avg Time to Answer: The average time calls spend in a Team's queue before they are answered.
- Service Level: AVOXI measures Service Level by the number of inbound calls in less than 15 sections divided by the number of inbound calls in total.
Monitor your Team's Call Distribution and Service Level
The Call Distribution chart allows you to monitor and measure team call statistics both in real-time and historically. Use the distribution chart to see a visualization of call volume and call events (answered, unanswered, abandoned), as well as Service Level performance.
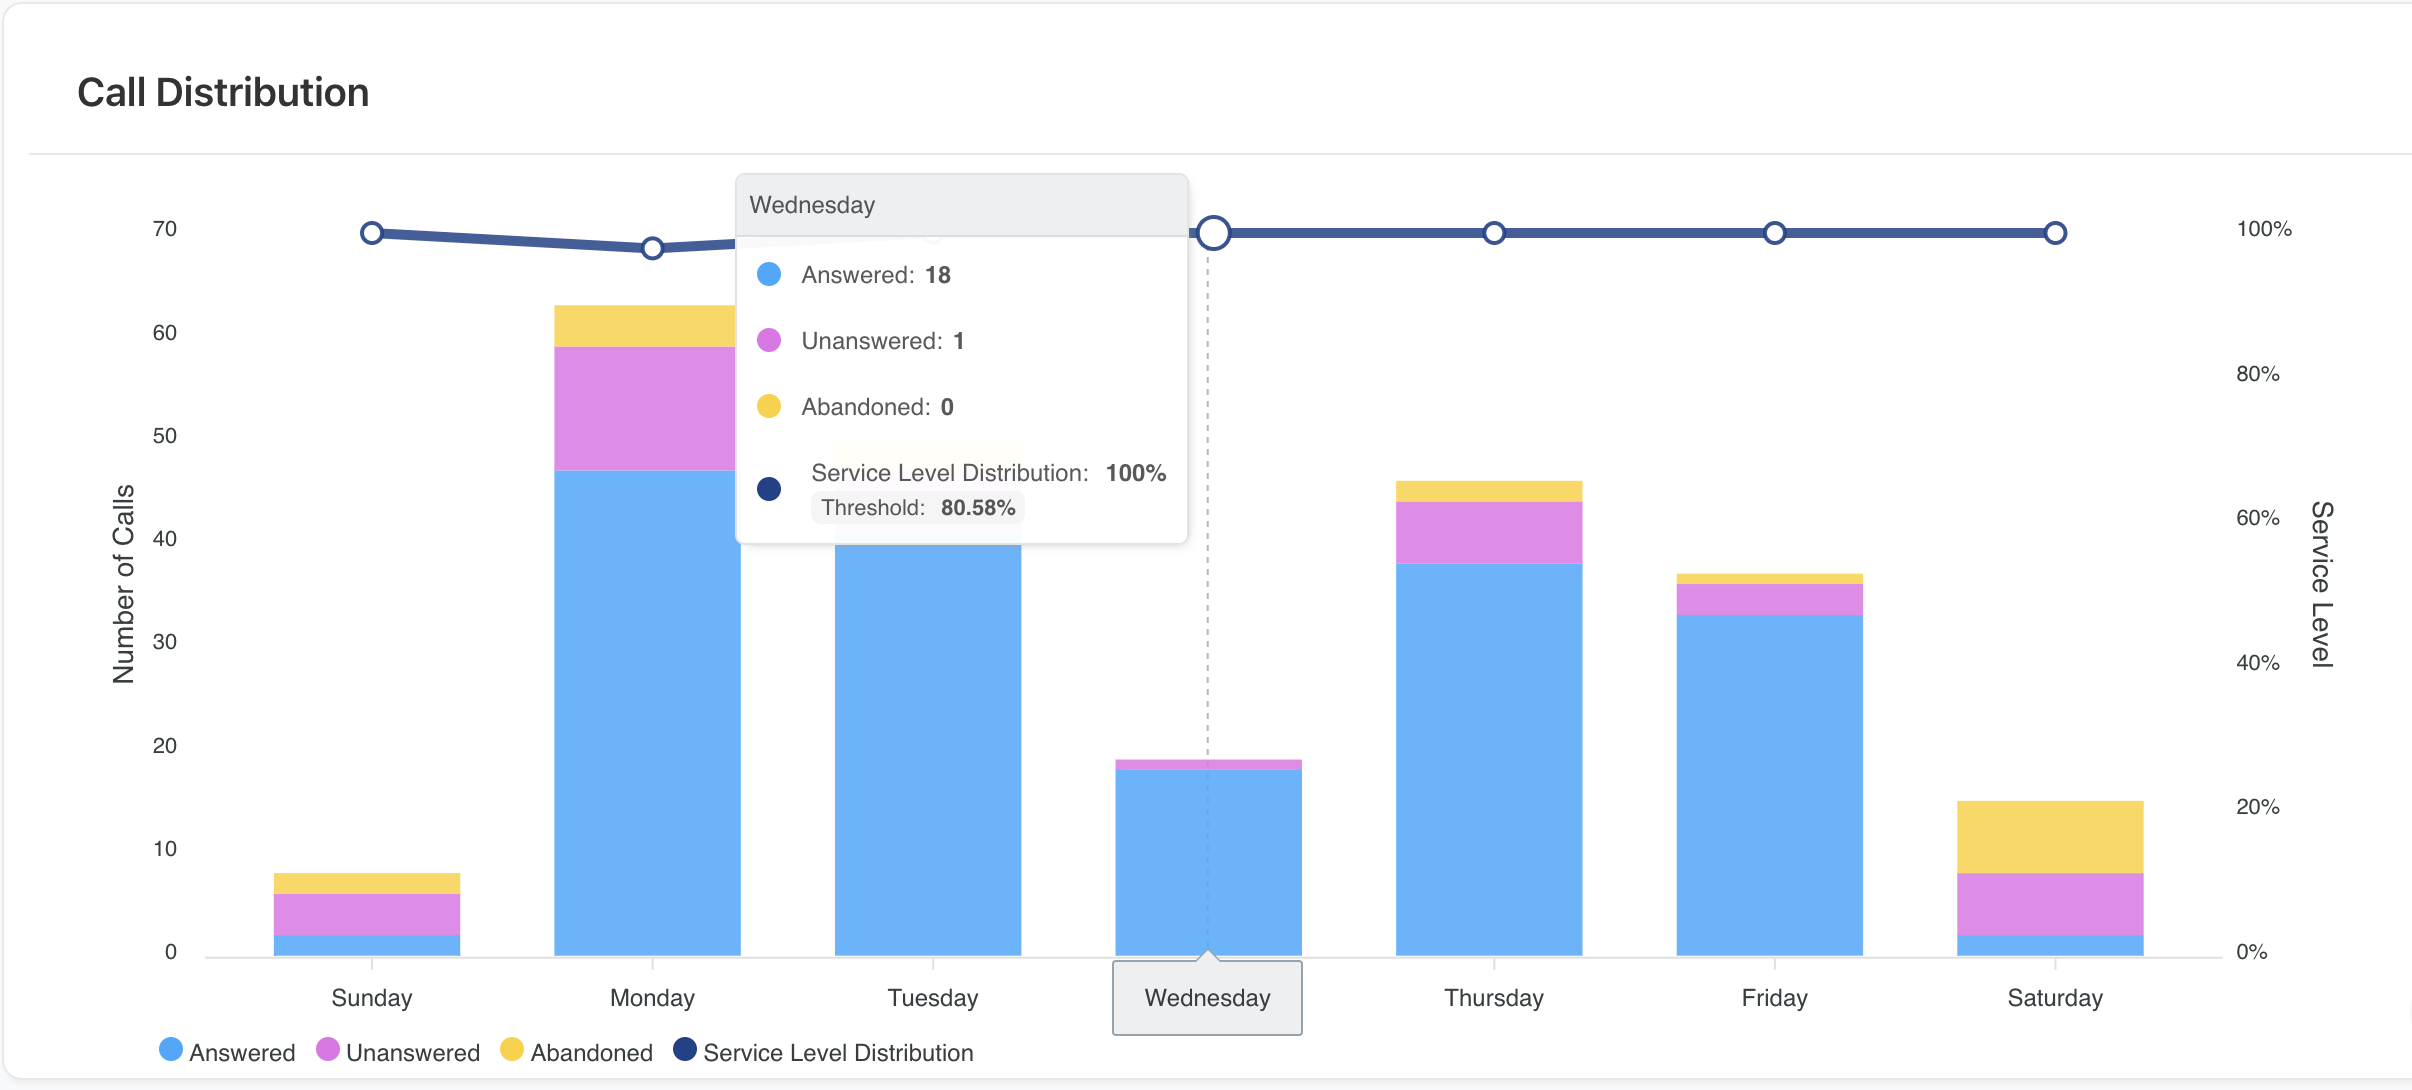
Service Level is defined as the percentage of incoming calls that are answered live within a set amount of time. "Average Time to Answer" is a key performance indicator used by call centers to help monitor agent performance. Genius Admins and Supervisors can track agents' average time to answer incoming calls. This helps improve the overall customer experience while allowing managers to measure agents' performance and highlight areas that require further attention.
AVOXI measures Service Level by the number of inbound calls answered in less than 15 seconds divided by the number of inbound calls answered in total.
Tip: Only answered or missed inbound calls during business hours are measured.
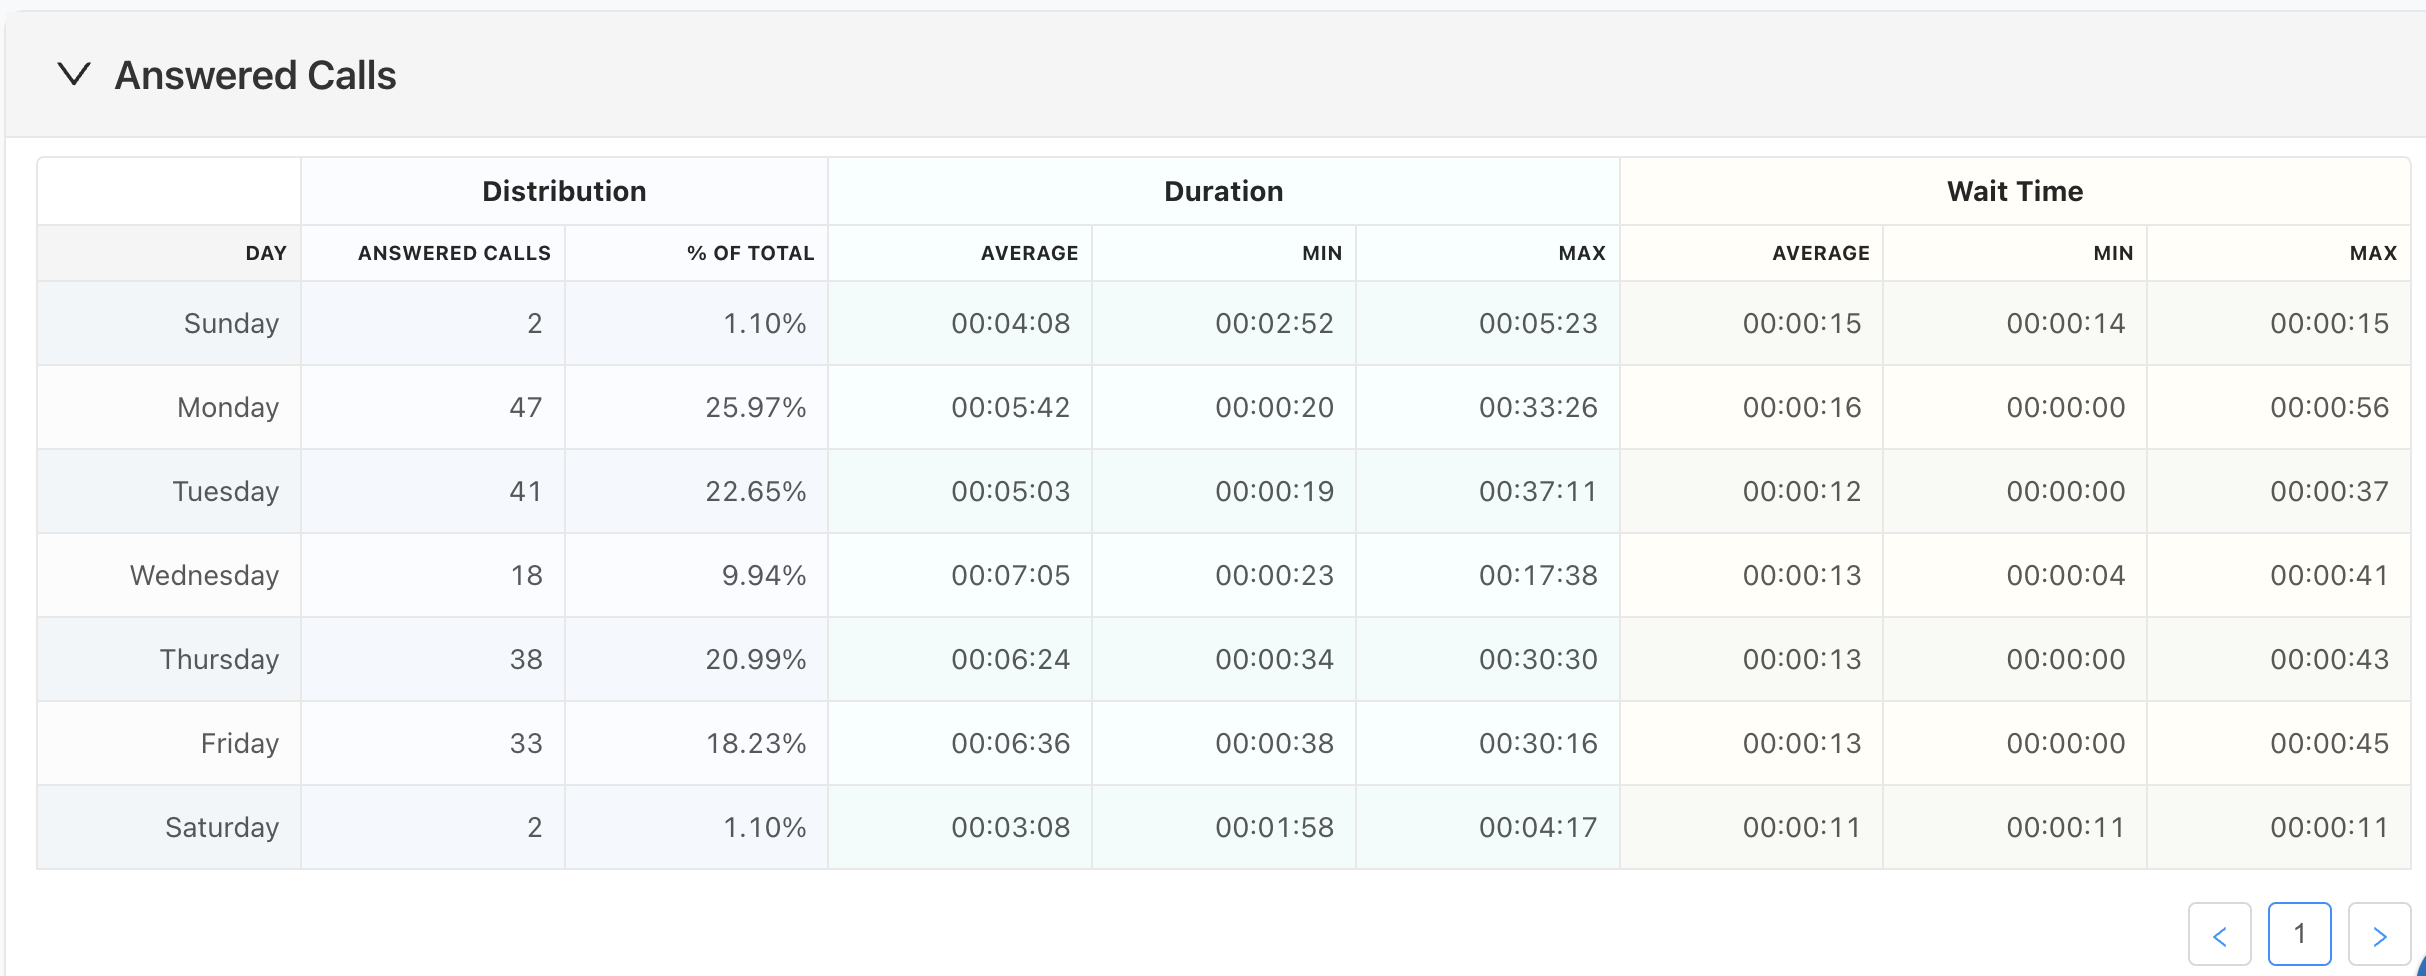
Call Distribution Table: Answered Calls
The Answered Calls table shows a call distribution of answered calls for the selected date range, organized by the selected data aggregation type (see above).
- Answered Calls - Number of answered calls
- % of Total - Percentage of answered calls that took place during this Day, Date, or Hour
- Average Duration - Average call duration
- Minimum Duration - Minimum call duration
- Maximum Duration - Maximum call duration
- Average Wait Time - Average call wait time
- Minimum Wait Time - Minimum call wait time
- Maximum Wait Time - Maximum call wait time
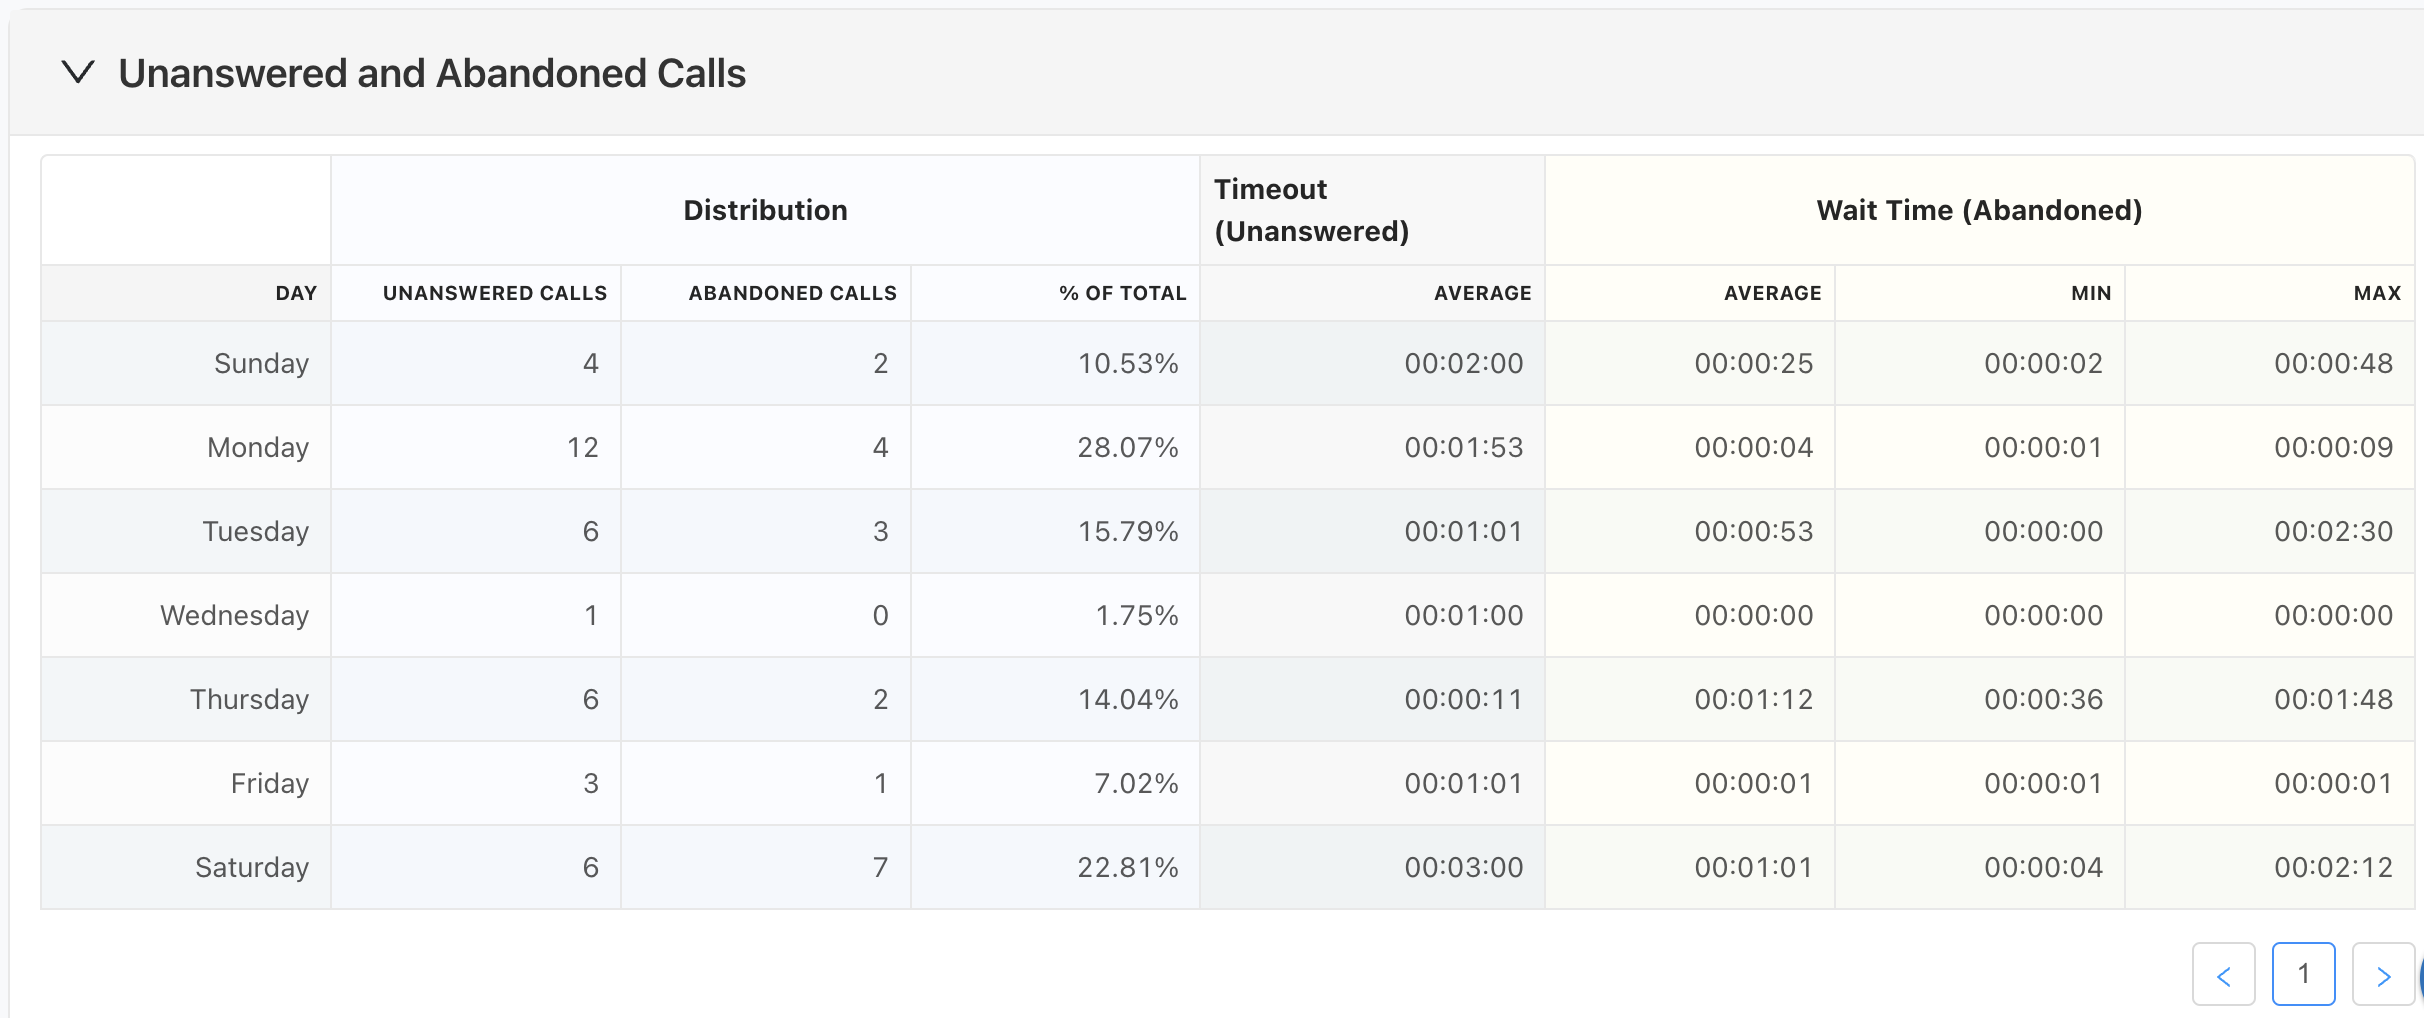
Call Distribution Table: Unanswered and Abandoned Calls
The Unanswered and Abandoned Calls table shows a call distribution of unanswered calls for the selected date range, organized by the selected data aggregation type(see above). Unanswered calls are calls that entered a queue and were not answered before the call timed out. Abandoned calls are calls where the caller disconnects before the agent answers.
- Unanswered Calls - Number of unanswered calls
- Abandoned Calls - Number of abandoned calls
- % of Total - Percentage of unanswered and abandoned calls that took place during this Day, Date, or Hour
- Timeout (Unanswered) - Average timeout for unanswered calls
- Average Wait Time - Average wait time before the caller disconnects
- Minimum Wait Time - Minimum wait time before the caller disconnects
- Maximum Wait Time - Maximum wait time before the caller disconnects
Tip: If you have the permission to do so, you can use the Share Report, Download, or Schedule reports features to share/download real-time metrics.