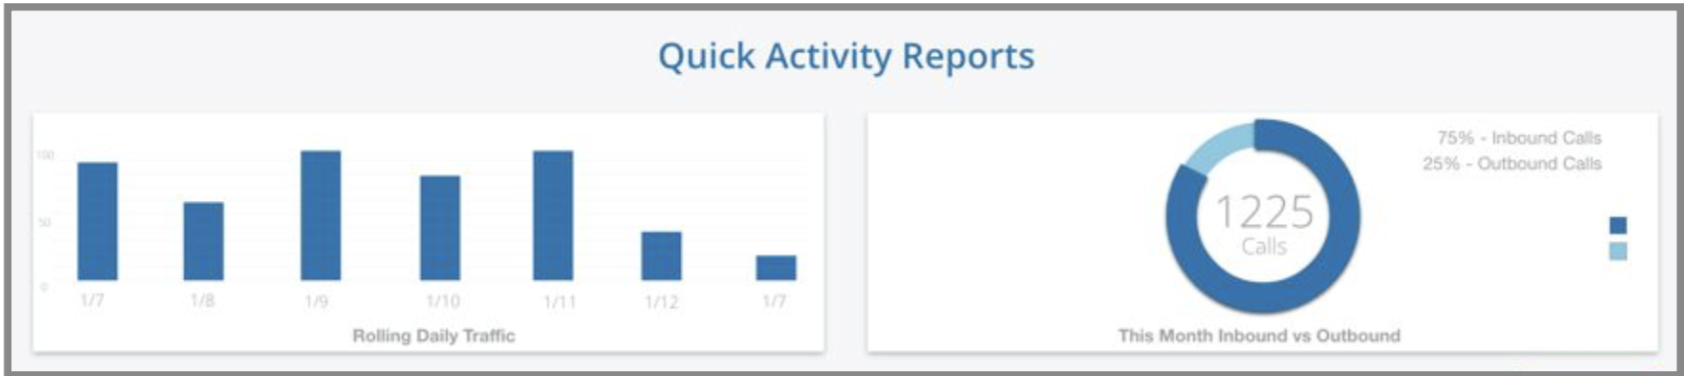
The bar graph on the left-hand side displays your account’s overall call traffic, by day, over the last 7 consecutive days.
The circle graph on the right-hand side shows the ratio of inbound vs outbound calls for your account for the current month. This graph includes data from the start of the month to the current day.